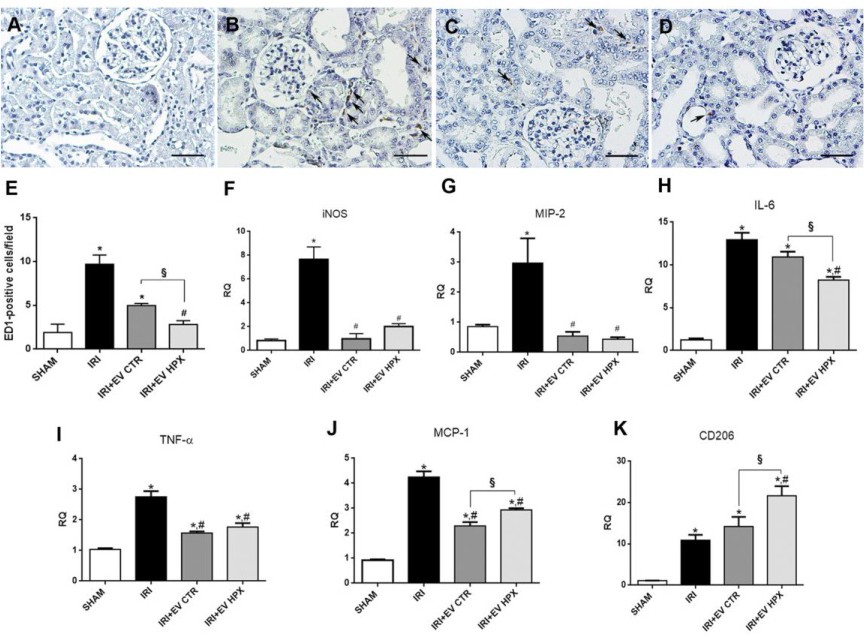
Fig. 7. Immunomodulatory response regulated by EV CTR and EV HPX after kidney injury. Representative photomicrographs of the renal tissue slide immunohistochemistry for ED-1 of the different conditions: SHAM (A), IRI (B), IRI+EV CTR (C) and IRI+EV HPX (D) (scale bars = 50 µm). Quantification of the number of ED-1-positive cells/field (black arrows) from immunohistochemistry photomicrographs (n = 6) (E). mRNA levels of iNOS (F), MIP-2 (G), IL-6 (H), TNF-α (I), MCP-1 (J), CD206 (K) in renal tissue expressed as RQ in respect to SHAM group (n = 5). Data represent mean ± SEM. (* indicates statistical difference to SHAM group; # indicates statistical difference to IRI group, § indicates statistical difference to IRI+EV CTR group, P<0.05 assessed by one-way ANOVA followed by Tukey's test). Abbreviations: EV extracellular vesicles; SHAM, false operate; CTR, control; HPX, hypoxia; IRI, ischemia-reperfusion injury; iNOS, inducible nitric oxide synthase; MIP-2, macrophage inflammatory protein 2; IL, interleukin; TNF-α, tumor necrosis factor-α; MCP-1, monocyte chemoattractant protein-1; RQ, relative quantification.